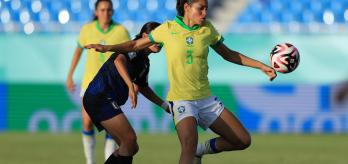
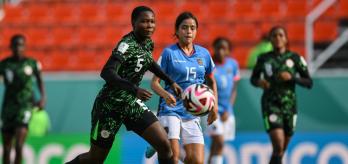
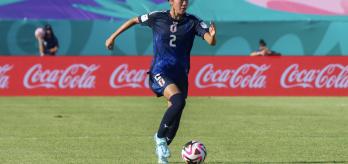
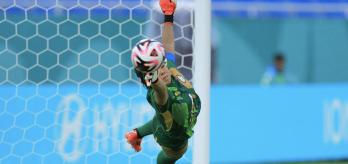
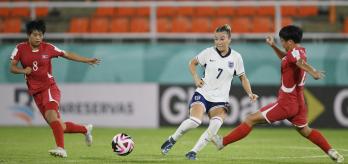
Collectively, teams implemented clear game strategies with in-game adaptability, both in regular play and from set plays, reflecting clarity in coaching instructions and understanding of roles. Our Technical Study Group (TSG) and Football Performance Insights Team (FPI) attended all games at the tournament and in this article, we present some of the data insights recorded during the post-tournament analysis process.
Goals scored
Our review of goals scored showed several similarities in the high-level data compared to the tournament two years ago. A total of 94 goals were scored in this competition, compared to 95 during the FIFA U-17 Women’s World Cup India 2022™, with runners-up, Spain recording the highest goal tally of 19, while the tournament winners, Korea DPR, were second-highest with 14. Bronze medallists, the USA, were also ranked third in the goalscoring table with 13.
The average goals per game in 2024 was 2.94 compared to 2.97 in 2022 and the average winning margin was 2.54 in the Dominican Republic compared to India’s 2.42. Of games that produced a winner, seven were won by a one-goal margin (12 in 2022), seven were decided by a two-goal margin (five in 2022) and the biggest winning margin in 2024 was by five goals with two games won by a 6+ margin in 2022, showing that most games in the tournament are competitive.
Goal timings
First-half goals increased slightly in 2024 from 39 in 2022 to 45, while second-half goals decreased from 56 in India to 45 in this competition. Teams were scoring earlier as 18 goals were scored in the first 15 minutes compared to 12 in the same time sector two years ago, while two goals were scored in injury time at the end of the first half compared to none in 2022.
Goal origins and locations
As can be seen in the graphic below, slightly more goals were scored from passes in 2024 (37.8%) compared to 34.4% in 2022. Goals from crosses were also slightly up (18.9% in the Dominican Republic v. 16.1% in India), while no goals were scored from direct free kicks in 2024 compared to two in 2022.
Excluding own goals from the data, a significant decrease in goals scored from outside the penalty area was recorded in 2024, dropping from 20 (21.5%) in 2022 to 12 (13.3%) in the Dominican Republic. Two reasons were noted by our TSG to explain this change, including teams consciously working to create higher value chances when in the final third and as Pascal Zuberbühler observes, this decrease is also a consequence of a notable improvement in how goalkeepers are dealing with attempts at goal from distance.
“It is clear that goalkeepers are reading these situations early, getting into good starting positions close to their goal line, so they can reduce the angle of depth for the player taking the strike at goal. They are strong physically, with upright postures and are getting set early. I was impressed with the little details around goalkeeper’s orientation in these situations, which meant they could react quickly to strikes at goal or adjust their positioning in relation to the movement of the ball. Goalkeeper saves in the top third of the goal increased in this tournament, and this clearly demonstrates their development in this aspect of goalkeeping,” he noted.
Use of squads/Timing of subs
During this tournament, three of the 16 teams used all 21 of their squad players during their matches played at the competition. Spain (runners-up) and England (4th place) did so across their six matches, while Ecuador used all squad players in their three group stage games. USA (3rd place) and Korea DPR (winners) also utilised most players in their squads, playing 20 and 19 of their 21 listed players respectively, with teams that went furthest in the competition having strong depth in their panels.
More substitutions were made in the first half of games (5.2%) compared to 2022 (1.6%) and while often first-half changes are due to injuries, it was noted by our TSG that a number of these early changes were tactical. The volume of half-time substitutions (18.4%) in 2024 remained constant with 18.5% recorded in 2022, while late changes (90+ mins) increased in 2024 to 8.9% from 6.6% in 2022. Interestingly, the goal and assist contributions made by subs decreased in 2024 from 34 (22.2%) in 2022 to 15 (9.7%) despite subs playing more minutes in the Dominican Republic.
Ball in play
A significant increase in ball-in-play time was recorded during the 2024 competition when compared with 2022. Two years ago, the average time the ball was in play during a game was 48:31 minutes, accounting for 48% of the total match time, whereas in the Dominican Republic, it rose to 53:53 minutes (51.7%).
According to TSG expert Vanessa Bernauer, “Players are becoming really competent on the ball and have high levels of technical skills, even when under pressure. It was very enjoyable to see the good habits these young players have like scanning the pitch before they receive the ball, taking high quality first touches to evade pressure and making good decisions about where and how to play the next pass. There is strong technical development in these players, and that directly correlates to the ball being in play for longer.”
Bernauer’s point is further reinforced when controlled possession is analysed. In 2024, teams had controlled possession of the ball for an average of 45.3% of the total playing time, compared to just 40% in 2022. The ball in contest time also reduced from 7.9% to 6.4%.
POSSESSION SHARE/PLAYING STYLES
When we break down each team’s possession share and explore the time they spent in each of the eight in-possession phases, we can gain insights into the playing styles of the different nations. Runners-up Spain had the highest percentage of possession share in their matches, averaging 62.1%, while winners Korea DPR averaged just 40.9%. This information proves that teams could be successful with different approaches when they had the ball. Spain liked to retain possession and build patiently, while Korea DPR had a more direct and fast approach to their build-ups/progression phases. Apart from Korea DPR, the other three semi-finalists (Spain, the USA and England) all averaged more time in possession than out of possession in their games.
As can be seen in graphic 7 below, only Kenya (9%) and Nigeria (12%) spent less time in low build-up than Korea DPR and Zambia (13%), while Mexico (34%) and Korea Republic (31%) spent the most time in this phase. Spain (22%) and Japan (21%) spent a higher percentage of their in-possession time in the mid build-up phase than other teams, while Nigeria (21%) and Korea DPR (20%) spent the highest percentage of in-possession time in the final third.
Kenya spent 42% of their in-possession time in attacking transition, higher than any other team, while Poland, Brazil and Ecuador (all 30%) were also strong in this phase. Again, highlighting the contrasting styles, Korea DPR spent 29% of their in-possession time in attacking transition, while Spain only spent 15% of theirs in this phase.
In graphic 8, this point is accentuated as we see that the winners, Korea DPR, progressed the ball towards their opponent’s goal quickly, with fewer distributions per possession sequence, preferring a faster, direct style while runners-up Spain were the lowest ranked for speed of possession progression and had the highest number of passes per possession sequence, favouring a more patient and considered approach.
Out of possession
Similarly, teams’ defensive styles are also indicative of the time they spend in each of the nine out-of-possession phases. As shown in graphic 9 below, teams spend more time in blocks than in the pressing phases. Winners Korea DPR spent the highest proportion of their out-of-possession time in the defensive transition phase (26%) and favoured the mid-block (23%) when in a controlled defensive shape. Spain’s most dominant defensive phases were defensive transition (31%) and counter-press (22%).
To measure a team’s defensive efficiency at winning the ball back close to the opponent’s goal, we combined the percentage of pressures applied in the final third with turnovers per 30 minutes out of possession. The average efficiency level for the tournament was 9.8 turnovers (P30OOP) with 15% of overall pressures applied occurring in the final third. As outlined in graphic 10 below, Nigeria and Spain ranked high for their efficiency when pressing in the final third, while Kenya, Korea Republic, Dominican Republic, and Poland seldom opted to press there. Interestingly, although both finalists, Korea DPR and Spain, had slightly different approaches to how and when they applied pressure, it is notable that both teams ranked high for pressures applied in the final third and turnovers.
Further tournament analysis
To compliment the information provided in our tournament overview, our TSG and FPI team have identified the following themes as being standout from the FIFA U-17 Women’s World Cup Dominican Republic 2024:


