Key points
-
The physical game demands have evolved significantly in the last decade, especially from a high-intensity perspective.
-
This physical analysis combined physical metrics with FIFA's Enhanced Football Intelligence metrics to add much-needed context to the data.
-
The findings could provide valuable insights for practitioners and may aid the development of specific training drills that replicate aspects of the game.
Introduction
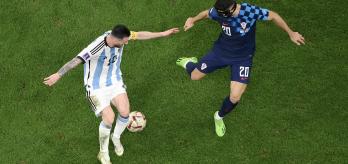
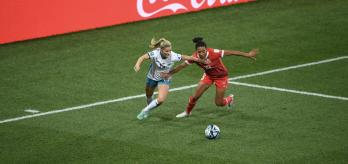
The FIFA World Cup Qatar 2022™ set new standards, both on and off the pitch. On the pitch, teams produced arguably some of the most intricate and entertaining technical and tactical football that the World Cup has ever seen. Despite the importance placed upon the technical and tactical qualities of the game, it is crucial to understand that the physical characteristics of football have evolved significantly over the last decade, especially from a high-intensity perspective1,2. Moreover, game-changing moments such as goalscoring opportunities typically include plenty of high-intensity activity3, hence the need to examine the physical demands of contemporary competitions such as the FIFA World Cup Qatar 2022.
The first of its kind
Although FIFA has traditionally analysed team and player performances after the tournament in a technical report compiled by the Technical Study Group, this is the first time that the physicality of the tournament has been analysed in such detail. The findings from such analyses could provide valuable information about the intensity of contemporary international tournaments, which could be useful in the development of specific training regimes. To enable these physical match analysis trends to be translated more effectively to practitioners, the author has attempted to layer context throughout the analysis to add a narrative to the numbers.
Method
All 64 games during the FIFA World Cup Qatar 2022 were analysed using a multi-camera optical tracking system (TRACAB Gen5, ChyronHego). All player movements were captured by high-definition cameras operating at 25Hz. The validity of this system was quantified by FIFA to verify the capture process and subsequent accuracy of the data4. After system calibration and various stringent quality control processes, the data was analysed using match analysis software. This produced a data set on each team and each player's activity pattern during a match using specified speed zones (Figure 1 below)
These speed zones have been commonly employed in elite domestic and international competitions for over a decade5,6. Another reason for utilising these zones is that they were also employed at the 2018 FIFA World Cup Russia™ and thus allow tournament comparisons to occur7. To further contextualise the physical trends, FIFA's Enhanced Football Intelligence metrics were also adopted8, specifically the phases of play metrics that captured the tactical behaviours of teams and players during games. These metrics were quantified by FIFA's Football Performance and Insights team, and the various definitions used to quantify both in- and out-of-possession phases of play are explained in the following video.
Analysis levels
To aid the reader's understanding of the physical trends, the data will be presented across various levels of complexity. This will commence with a basic summary of "what" distances players and teams covered in the FIFA World Cup Qatar 2022, before peeling away the complex layers associated with "when", "how" and "why" they covered that distance, using contextual information to aid understanding. This will enable practitioners to benchmark performances but more importantly to gain insights into the tactical aspects that may influence the physical demands.
Composition of team and positional analyses
Team analyses involved the summation of all match physical performance values of outfield players who participated in games, including substitutes (no goalkeeper data was included). Thus, data trends are the sum of all individual outfield player values presented as team totals. Positional analyses involved the examination of the match physical performances of individual players in various tactical roles in the team. The data provider assigned eight different outfield tactical roles to enable positional differences to be determined. Only players who completed the entire match were evaluated. All analyses were performed on match data collected over the duration of a normal match or regular time plus added time (e.g. 90-94 minutes), but no extra-time data was included.
References
-
Bradley PS, Carling C, Bush M, Hogg B, Archer D, Barnes C. Tier-specific evolution of match performance characteristics in the English Premier League: it's getting tougher at the top. Journal of Sports Sciences. 2016, 34: 980-987.
-
Bradley PS, Scott D. Physical Analysis of the FIFA Women's World Cup France 2019™. 2020, Zurich: FIFA. Available from: https://img.fifa.com/image/upload/zijqly4oednqa5gffgaz.pdf.1-168. [accessed March 2023]
-
Faude O, Koch T, Meyer T. Straight sprinting is the most frequent action in goal situations in professional football. Journal of Sports Sciences. 2012, 30: 625-631.
-
FIFA. Electronic Performance & Tracking Systems Test Report: Tracab Gen5. 2022, Zurich: FIFA. Available from: https://www.fifa.com/technical/football-technology/resource-hub?id=6f21700665d54b3e993a063e9cda109e. [accessed March 2023]
-
Bradley PS, Carling C, Gomez Diaz A, Hood P, Barnes C, Ade J, Boddy M, Krustrup P, Mohr M. Match performance and physical capacity of players in the top three competitive standards of English professional soccer. Human Movement Science. 2013, 32: 808-821.
-
Da Mota GR, Thiengo CR, Gimenes SV, Bradley PS. The effects of ball possession status on physical and technical indicators during the 2014 FIFA World Cup Finals. Journal of Sports Sciences. 2016, 34: 493-500.
-
FIFA. Technical Report: 2018 FIFA World Cup Russia™. 2018, Zurich: FIFA.
Available from:https://digitalhub.fifa.com/m/eaaaf883d572feac/original/xgwsmrcals5qku0nmrge-pdf.pdf. [accessed March 2023] -
FIFA. Enhanced Football Intelligence Metrics: Phases of Play. 2022, Zurich: FIFA. Available from: https://www.fifatrainingcentre.com/en/fwc2022/efi-metrics/efi-metric--phases-of-play.php. [accessed March 2023]


