Key points
-
Playing against teams that have a high or low physicality directly impacts the total distance covered by a team as well as the distance covered at higher intensities.
-
High-intensity runs are strongly related to phases of play that have a real urgency directly attached to their outcome (e.g. defensive recoveries, final-third movements).
-
Moderate speed runs are more strongly associated with metrics linked to attacking and defensive organisation (e.g. build-up play, various press and block events).
THE INFLUENCE OF THE OPPOSITION ON MATCH PHYSICAL PERFORMANCES
One of the most powerful "why" factors influencing a team's physical output is the opposition they play against. For example, the "action-reaction" nature of football means that for every action from one team (e.g. runs during an attacking transition), it creates a somewhat equal and opposite reaction from the other team (e.g. runs during a defensive transition)1. Although this example is somewhat crude, it explicitly highlights that the work rate of a team is somewhat impacted by the physicality, tactics and quality of their opposition2. These factors, amongst many others, will require a team to up or downregulate their physical exertions accordingly. The reasons "why" teams run are immensely complex and thus this section will only cover a few of the numerous factors impacting a team's physicality.
Why the opposition's place on the physical output continuum matters
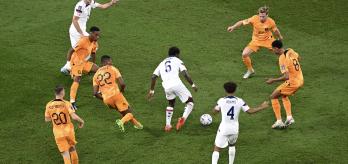
Figures 1-3 illustrate teams with a high or low physicality and the resultant impact this had on the work rates of their opposition in the FIFA World Cup Qatar 2022™. Teams at the two ends of the physical output continuum included the USA and Canada at the high end, with Ecuador and Costa Rica at the low end. Figure 1 reveals that when teams played against the USA or Canada, they covered around 4% more distance in total compared to the average for all of their other World Cup games. Specifically, it was evident that IR Iran, the Netherlands and particularly Wales covered more total distance against the USA, with only England matching their average World Cup physical outputs. Similarly, playing against Canada saw both Croatia and Belgium upregulate their total distances but this trend was not replicated for Morocco.
In contrast, playing against Costa Rica or Ecuador decreased the total distance covered by 1-6% compared to the average for all other World Cup games. For instance, Qatar, the Netherlands and Senegal all downregulated their total distance covered against Ecuador, whilst Japan and Germany did the same against Costa Rica, but Spain covered their greatest total distance of the tournament during their 7-0 win against Costa Rica. This bucked the trend completely but was due to Spain's dominant performance over Costa Rica in conjunction with >1,000 passes made and a 75% ball possession statistic (i.e. an unusual game).
Figure 2 highlights similar trends as teams that played against the USA or Canada covered 3-17% more high-intensity distance (>20km/h) compared to the average for all of their other World Cup games. Against the USA, it was clear that Wales and the Netherlands upregulated their high-intensity running versus their tournament average, but this was not the case for England or IR Iran. However, playing against Canada saw Croatia, Belgium and Morocco upregulate their high-intensity running by a large magnitude compared to their other World Cup games. By contrast, playing against Ecuador meant that Qatar, the Netherlands and Senegal downregulated their high-intensity running. This trend continued against Costa Rica with large declines for Germany and Japan compared to their tournament average, but with Spain once again bucking the trend.
Figure 3 highlights similar trends but of a larger magnitude, as teams playing against the USA or Canada covered 3-24% more distance sprinting (>25km/h) than their tournament average. Against the USA, both England and the Netherlands increased their sprint distances, whilst IR Iran and Wales decreased their sprint distances compared to the average for all of their other World Cup games. All teams increased their sprint distances by a similar magnitude against Canada. In contrast, playing against Costa Rica or Ecuador meant that their opposition's sprint distance decreased by 17-18%. With the exception of Spain, who demonstrated a similar sprinting performance against Costa Rica compared to their World Cup average, all other teams illustrated sprinting declines when playing against either Costa Rica or Ecuador.
Contextualising trends with FIFA's Enhance Football Intelligence metrics
Data obtained from FIFA's Enhanced Football Intelligence metrics may highlight the missing pieces of the puzzle as to "why" certain teams impact their opposition's physicality. For instance, the USA and Canada performed a high number of movements to receive, progressions and final-third events compared to the World Cup average. Moreover, the USA were in the upper percentiles for the total number of transitions, whilst Canada were in the upper percentiles for pressing high up the pitch.
Logically, these activities may not only be physically taxing for their own players but could also influence the work rate of their opposition. By contrast, Costa Rica frequently sat compactly in a defensive low or mid-block for extended periods, which may not only reduce their opportunity to move into space but could also limit the movements of the opposition, especially in behind due to their deeper position. Both Ecuador and Costa Rica also performed a low number of movements to receive, progressions and final-third entries that could result in less reactive movement from the opposition to defend against them.
QUADRANT ANALYSIS OF PHYSICAL METRICS VERSUS TACTICAL PHASES OF PLAY
Another powerful "why" factor influencing a team's physical output is the tactical approach that they employ. One challenge for practitioners is to link the physical and tactical metrics together to determine this. Direct methods simultaneously align the physical efforts with the tactical phases of play or scenarios1,2,3. Unfortunately, this physical-tactical integration was not possible for this analysis and thus another indirect method was utilised to connect the metrics. For instance, all physical and tactical metrics were correlated against each other to determine any noteworthy associations. It is important for the reader to be mindful that correlation does not equal causation when examining the trends below.
Interestingly, the strongest correlations for the high-intensity speed zone (>20km/h) occurred for phases of play that had a real urgency directly attached to their outcome (e.g. risk/benefit)4. Out of possession, this included high-intensity efforts to defensively recover, transition or counter-press. Similarly, in possession, this included high-intensity efforts to progress up the pitch and into the final third to be an attacking threat. For instance, the quadrant plot in Figure 4 displays the number of high-intensity runs without the ball versus the combined number of events for defensive recoveries and transitions.
The latter two phases were combined given their similar purpose (e.g. to recover quickly into a better shape). Saudi Arabia, Canada, IR Iran and Australia clearly fall within the upper-right quadrant as they performed a plentiful number of each. Due to the potential consequences of not tracking back, it is not surprising that teams work intensely during defensive recoveries/transitions5. Thus, it is likely that these two metrics are somewhat linked.
Counter-pressing
Strong associations were also found between the number of high-intensity runs performed without the ball and the number of counter-press events (data not displayed). This seems logical as counter-pressing involves aggressive pressure on the ball in an attempt to win it back quickly before the opposition can settle. Thus, it is unsurprising that counter-pressing teams such as Saudi Arabia, Australia, IR Iran, Uruguay and Ghana all fall in the upper-right quadrant. Teams will find frequent counter-pressing particularly taxing as this relies on a team's ability to react quicker than the opposition by producing explosive runs to press.
Progressions and final-third events
Figures 5 and 6 show that the number of high-intensity runs performed with the ball correlates strongly with the number of progression and final-third events. Both of these associations are remarkably similar and could suggest that teams up their intensity once they progress the ball forward and/or into the final third via vertical passes or dribbling in an attempt to be an attacking threat. More attacking teams in the upper-right quadrant, such as Germany, Spain and Brazil, progressed up the pitch and into the final third quicker and more frequently than deeper, more defensive teams such as Costa Rica, Poland, Australia and Japan that are in the lower-left quadrant (Figures 5 and 6).
Moderate-intensity runs' link to organisational play
High-intensity runs (>20km/h) correlated more strongly with phases of play that had a real urgency directly attached to them. In contrast, moderate speed runs (15-20km/h) were more strongly associated with metrics linked to attacking and defensive organisation (e.g. build-up play, various press and block events). Figure 7 displays the number of moderate speed runs without the ball versus the number of low-block events for all 32 teams.
Japan and Costa Rica can be found in the upper-right quadrant as they regularly moved into a compact and narrow defensive shape in their own third to prevent the opposition from penetrating their penalty area. This required teams to move in an organised manner as a unit, potentially explaining its stronger association with moderate rather than high-speed running. Canada, Germany and the USA can be found in the upper-left quadrant as they produced a plentiful number of moderate speed runs but instead, they pressed and blocked higher up the pitch. Spain, England and Portugal kept the ball well and thus produced a lower number of moderate speed runs without the ball and defended higher up the pitch, hence their lower-left quadrant position.
Build-up play and movements to receive
Figure 8 illustrates the number of moderate speed runs with the ball versus the number of unopposed build-up events in the middle third. Spain's style of play ensured that they are the clear outlier in the upper-right quadrant, but other teams such as England and Portugal also had a high proportion of ball possession and regularly played out from the back and in the middle third. In contrast, teams like Costa Rica, IR Iran and Poland had less ball possession and were more likely to play direct than build up from the back unopposed. As build-up play requires players to pass and move to progress the ball forward, moderate movement speeds are much more appropriate to enable the ball possession to be retained effectively whilst still fast enough to move the ball into more advanced areas.
Figure 9 demonstrates the association between the number of moderate speed runs with the ball and the number of movements to receive events. This latter metric is not a phase of play but directly links to most of the in-possession phases of play, potentially explaining the strong correlation found here. High ball-possession teams such as Spain, England, Portugal and Germany are unsurprisingly in the upper-right quadrant as they may have performed more moderate speed runs in front, in behind and between the lines to receive the ball. As these movements are usually over short distances and may need the player receiving the ball to be able to control it appropriately, it is understandable that moderate speed runs correlate so strongly with this metric compared to runs at other speeds.
References
-
Bradley PS. The Premier League Way: Contextualising the Demands of the World's Most Intense League. 2022, Amazon, UK.
-
Ju W, Hawkins R, Doran D, Gómez-Díaz A, Martín-García A, Evans M, Laws A, Bradley P. Tier-specific contextualised high-intensity running profiles in the English Premier League: more on-ball movement at the top. Biology of Sport. 2023, 40: 561-573.
-
Bradley PS, Ju W, Ade J, Laws A, Gomez Diaz A, Evans M. Beyond 'blind' distance covered in football match analysis: is it time to progress to a contextualised paradigm? Football Analytics: Now and Beyond, Barça Innovation Hub Guide. 2020, 130-145.
-
Paul DJ, Bradley PS, Nassis GP. Factors affecting match running performance of elite soccer players: shedding some light on the complexity. International Journal of Sports Physiology and Performance. 2015, 10: 516-519.
-
Ju W, Doran D, Hawkins R, Gómez-Díaz A, Martin-Garcia A, Ade J, Laws A, Evans M, Bradley P. Contextualised peak periods of play in English Premier League matches. Biology of Sport. 2022, 39: 973-983.


